AMD 3rd Gen EPYC Milan Review: A Peak vs Per Core Performance Balance
by Dr. Ian Cutress & Andrei Frumusanu on March 15, 2021 11:00 AM ESTDisclaimer June 25th: The benchmark figures in this review have been superseded by our second follow-up Milan review article, where we observe improved performance figures on a production platform compared to AMD’s reference system in this piece.
Power & Efficiency: IOD Power Overhead?
In the server CPU space, especially at higher core counts where the CPUs are limited in their performance by the TDP limits of the design, higher power efficiency infers higher performance. In the context of AMD’s newest Milan parts, before we continue on to the performance benchmarks, I wanted to cover in more detail a few odd aspects of the new parts which differ quite a bit to Rome when it comes to power consumption.
It’s to be noted that during AMD’s presentation and our briefing on Milan, the company hadn’t made a single mention of power or energy efficiency, which was already a bad sign of some things to come.
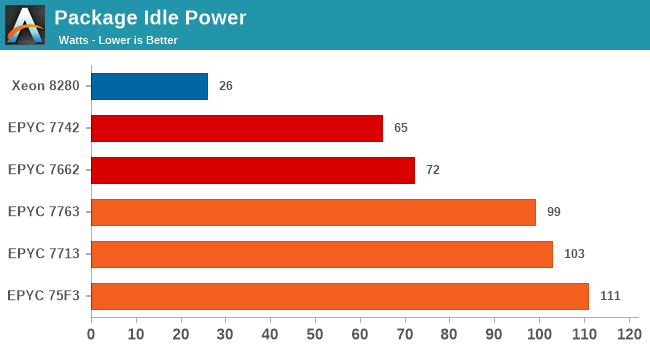
The first thing to appear as quite unusual on the new Milan parts was the idle power consumption of the various new SKUs. On the last generation Rome platform, I had measured package power of a single socket idling at around 65W. Compared to regular desktop CPUs this is quite a lot, however seemed relatively normal given the 8 memory controller channels, tons of I/O, as well as the fact that AMD uses an MCM/chiplet design which could possibly have a power overhead at low load. This figure was already higher than competing monolithic solutions from Intel or Ampere – I don’t have the exact figures at hand here and that’s why I didn’t include them in the chart but I remember seeing around 30-50W idle there.
Unfortunately, on Milan, this figure has seemingly risen to around 100W, reaching up to 111W in our test of the 75F3 system. This 30-40W increase in package power was a bit worrying as that shouldn’t normally be something you’d see in idle situations, where power management normally would kick in to reduce power consumption of the system.
I’ve proceeded to run all our SPEC workloads with power tracing of the system’s package and core power. We’re using AMD’s energy counters to achieve this, and are simply measuring in the start and end energy consumption, meaning there’s zero overhead and we have a precise figure in Joules based on how much the system has consumed during a workload (At least as precise as the numbers are reported). It’s to be noted that while the package power is evident in what it shows, simply the total energy of the socket package, the “core” power consumption metric is limited to just the individual CPU cores and their private L2 caches, without any of the shared L3 or other un-core components.
We’re comparing the power behaviour of four parts: For the Rome SKUs, we’re using an EPYC 7742 as well as an EPYC 7662. For the Milan parts, we’re using the 7663 and the 7713. It’s to be noted that because the EPYC 7663 is normally a 280W part, we’ve tuned down the power consumption via cTDP and PPT to 225W – this is not the way you’d normally operate the part but represents an interesting data-point when comparing things to the three other 225W CPUs.
I’d also like to mention that AMD had made note that the 7713 is meant to be positioned as a successor to the 7662, not the 7742, which is meant to be a higher-binned more power efficient part. However due to due 7713 coming in at almost the same price as the 7742 at launch, and due to the power behaviour of the two chips, I see these to chips as the better apples-to-apples generational comparison, although the argument we’re making also applies to the 7662 comparison.
| Rome vs Milan Power Efficiency | |||||||||||||
| SKU | EPYC 7742 (Rome) |
EPYC 7662 (Rome) |
EPYC 7663 (Milan) |
EPYC 7713 (Milan) |
|||||||||
| TDP Setting | 225W |
225W |
225W (cTDP down) |
225W |
|||||||||
| Perf |
PKG (W) |
Core (W) |
Perf | PKG (W) |
Core (W) |
Perf | PKG (W) |
Core (W) |
Perf | PKG (W) |
Core (W) |
||
| 500.perlbench_r | 268 | 220 | 141 | 238 | 192 | 107 | 253 | 220 | 112 | 239 | 221 | 104 | |
| 502.gcc_r | 239 | 208 | 105 | 228 | 189 | 83 | 246 | 220 | 92 | 240 | 219 | 83 | |
| 505.mcf_r | 141 | 203 | 95 | 139 | 187 | 77 | 153 | 220 | 85 | 153 | 218 | 75 | |
| 520.omnetpp_r | 134 | 207 | 109 | 131 | 189 | 87 | 139 | 220 | 92 | 136 | 217 | 82 | |
| 523.xalancbmk_r | 166 | 205 | 96 | 157 | 189 | 78 | 164 | 219 | 93 | 157 | 218 | 85 | |
| 525.x264_r | 567 | 220 | 147 | 512 | 194 | 114 | 505 | 220 | 113 | 475 | 221 | 105 | |
| 531.deepsjeng_r | 232 | 218 | 138 | 214 | 194 | 109 | 239 | 221 | 114 | 226 | 221 | 106 | |
| 541.leela_r | 264 | 210 | 144 | 243 | 192 | 117 | 250 | 220 | 119 | 240 | 220 | 110 | |
| 548.exchange2_r | 486 | 213 | 150 | 441 | 193 | 119 | 436 | 220 | 121 | 412 | 221 | 113 | |
| 557.xz_r | 184 | 208 | 120 | 174 | 190 | 96 | 178 | 221 | 103 | 171 | 220 | 93 | |
| SPECint2017 | 240 | 210 | 119 | 224 | 190 | 96 | 235 | 220 | 102 | 225 | 219 | 93 | |
| kJ Total | 1745 | 1681 | 1844 | 1904 | |||||||||
| Score / W | 1.143 | 1.176 | 1.066 | 1.028 | |||||||||
| 503.bwaves_r | 334 | 195 | 90 | 329 | 184 | 76 | 354 | 217 | 81 | 354 | 216 | 72 | |
| 507.cactuBSSN_r | 204 | 216 | 118 | 196 | 195 | 93 | 205 | 220 | 94 | 198 | 220 | 86 | |
| 508.namd_r | 261 | 221 | 154 | 233 | 193 | 116 | 229 | 219 | 115 | 217 | 219 | 107 | |
| 510.parest_r | 114 | 204 | 97 | 112 | 186 | 77 | 152 | 221 | 86 | 148 | 219 | 75 | |
| 511.povray_r | 353 | 223 | 160 | 299 | 188 | 114 | 308 | 220 | 119 | 286 | 220 | 111 | |
| 519.lbm_r | 35 | 186 | 84 | 35 | 184 | 77 | 39 | 210 | 76 | 39 | 215 | 72 | |
| 526.blender_r | 327 | 220 | 131 | 295 | 194 | 100 | 316 | 220 | 109 | 299 | 220 | 101 | |
| 527.cam4_r | 336 | 217 | 113 | 320 | 195 | 89 | 359 | 220 | 92 | 343 | 218 | 83 | |
| 538.imagick_r | 401 | 213 | 148 | 356 | 189 | 115 | 377 | 220 | 119 | 355 | 221 | 111 | |
| 544.nab_r | 241 | 218 | 150 | 217 | 193 | 116 | 217 | 220 | 116 | 204 | 221 | 108 | |
| 549.fotonik3d_r | 108 | 194 | 90 | 107 | 183 | 76 | 111 | 213 | 79 | 111 | 216 | 73 | |
| 554.roms_r | 82 | 202 | 94 | 81 | 184 | 74 | 88 | 220 | 83 | 88 | 217 | 73 | |
| SPECfp2017 | 191 | 200 | 101 | 180 | 186 | 83 | 193 | 217 | 88 | 187 | 217 | 80 | |
| kJ Total | 4561 | 4363 | 4644 | 4740 | |||||||||
| Score / W | 0.953 | 0.965 | 0.894 | 0.861 | |||||||||
In terms of absolute power consumption, all the parts generally land in the same 220W range figure, although we do see that in terms of actual measured power the Rome parts are a bit more conservative, especially the 7662. We’re running the CPUs in performance determinism mode – power determinism would always fill out the configured TDP but possibly would have little positive performance impact and certain power efficiency regressions.
What’s interesting to showcase and point out to between the four SKUs is the ratio between the power consumption of the total package and the actual cores which varies between the Rome and Milan generation parts.
Particularly what we’re interested in are workloads that are less memory-bound, and more core-local – in essence more typical compute heavy workloads such as 525.x264 or 511.porvray.
In such workloads, although we’re seeing that between the 7742, 7763, and 7713 (and to a lesser extent, the 7662), all SKUs are posting measured package power consumption figures that are pretty much identical. However, the core power consumption figures are very different, with the Rome 7742 part posting significantly higher figures than the new Milan chips, sometimes up to in the 40-50W range.
It’s exactly in these workloads where we actually see performance of the new Milan parts showcase a regression compared to the Rome parts. Anything that is less memory bound and requires the package power to be allocated towards just the CPU cores is notably favouring the Rome parts, allowing those chips to outperform the newer Milan parts.
The end-result is that although at equal TDP Milan has a theoretical IPC improvement, and does showcase benefits in workloads that are more heavily memory oriented, the actual geomean results of the new chips are actually just generationally flat – all whilst showcasing higher power and energy consumption, meaning that the new chips have perf/W regression of around 15%.
This regression seems to stem from an increase power overhead on the part of the new faster IOD of Milan (New L3 design could also be a factor). Effectively this increased power behaviour is reducing the effective usable power envelope of the actual cores, having a negative effect on performance, counteracting this generation’s IPC improvements at the worst case.
We had communicated our findings to AMD, but with no real resolution to the situation – so it does not seem to be a problem of misconfigured power management on the part of the test platform.

Indeed, charting the SPEC results across scaling thread counts in the system showcases that while at full load the differences between a 7713 and 7742 are almost nothing, at lower utilisations there’s actually a larger advantage in favour of the new Milan part, from 5% at 56 cores and growing larger the less cores are used. We’re seeing a huge >20% performance advantage at <8 threads, likely tied to the fact that at such low thread counts each core can take advantage of the full L3 in each chiplet/CCD.
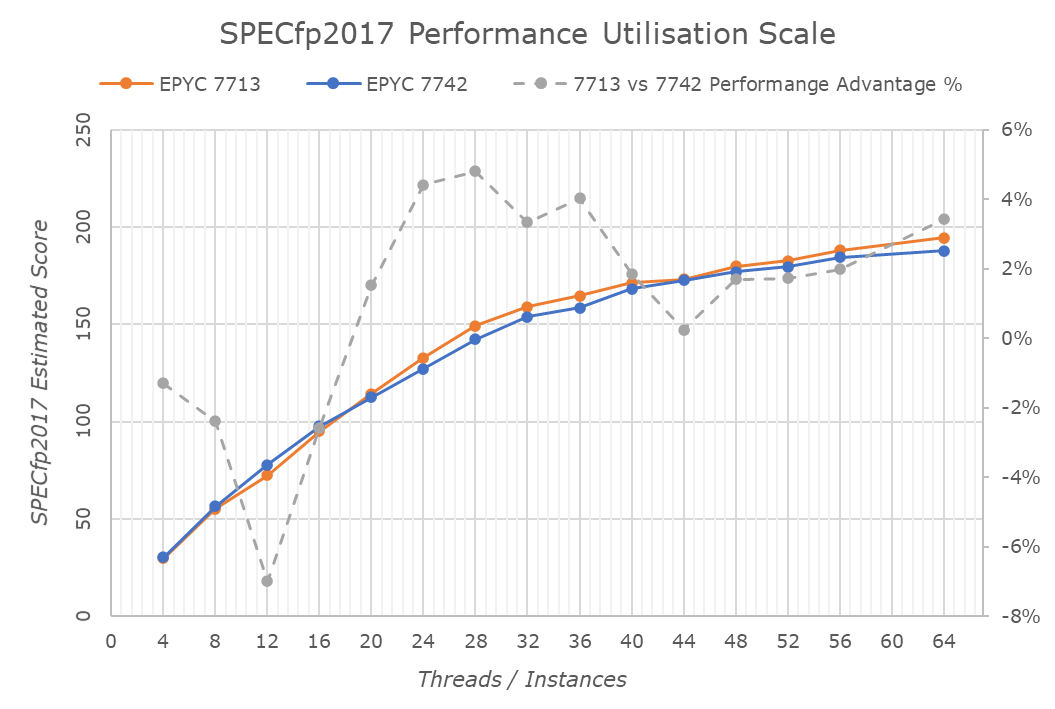
On SPECfp2017, oddly enough the advantages of the new Milan-based 7713 are less pronounced than in SPECint2017, even showcasing performance regressions at lower thread counts. I’m not too sure what the reason here is, but the new Zen3 CCX keeping its aggregate total L3 bandwidth equal whilst serving double the number of cores could have something to do with it, with performance at higher core counts recuperating and being improved due to the new lower-latency and higher clock IOD of Milan.
Whatever the technical background of this new odd power behaviour, it’s clear that it has negative consequences for the new Milan parts, possibly resulting in lower-than-expected generational performance improvements, as we’ll see in the next few pages.


120 Comments
View All Comments
mkbosmans - Tuesday, March 23, 2021 - link
Even if you have a nice two-tiered approach implemented in your software, let's say MPI for the distributed memory parallelization on top of OpenMP for the shared memory parallelization, it often turns out to be faster to limit the shared memory threads to a single socket of NUMA domain. So in case of an 2P EPYC configured as NPS4 you would have 8 MPI ranks per compute node.But of course there's plenty of software that has parallelization implemented using MPI only, so you would need a separate process for each core. This is often because of legacy reasons, with software that was originally targetting only a couple of cores. But with the MPI 3.0 shared memory extension, this can even today be a valid approach to great performing hybrid (shared/distributed mem) code.
mode_13h - Tuesday, March 23, 2021 - link
Nice explanation. Thanks for following up!Andrei Frumusanu - Saturday, March 20, 2021 - link
This is vastly incorrect and misleading.The fact that I'm using a cache line spawned on a third main thread which does nothing with it is irrelevant to the real-world comparison because from the hardware perspective the CPU doesn't know which thread owns it - in the test the hardware just sees two cores using that cache line, the third main thread becomes completely irrelevant in the discussion.
The thing that is guaranteed with the main starter thread allocating the synchronisation cache line is that it remains static across the measurements. One doesn't actually have control where this cache line ends up within the coherent domain of the whole CPU, it's going to end up in a specific L3 cache slice depended on the CPU's address hash positioning. The method here simply maintains that positioning to be always the same.
There is no such thing as core-core latency because cores do not snoop each other directly, they go over the coherency domain which is the L3 or the interconnect. It's always core-to-cacheline-to-core, as anything else doesn't even exist from the hardware perspective.
mkbosmans - Saturday, March 20, 2021 - link
The original thread may have nothing to do with it, but the NUMA domain where the cache line was originally allocated certainly does. How would you otherwise explain the difference between the first quadrant for socket 1 to socket 1 communication and the fourth quadrant for socket 2 to socket 2 communication?Your explanation about address hashing to determine the L3 cache slice may be makes sense when talking about fixing the inital thread within a L3 domain, but not why you want that that L3 domain fixed to the first one in the system, regardless of the placement of the two threads doing the ping-ponging.
And about core-core latency, you are of course right, that is sloppy wording on my part. What I meant to convey is that roundtrip latency between core-cacheline-core and back is more relevant (at least for HPC applications) when the cacheline is local to one of the cores and not remote, possibly even on another socket than the two thread.
Andrei Frumusanu - Saturday, March 20, 2021 - link
I don't get your point - don't look at the intra-remote socket figures then if that doesn't interest you - these systems are still able to work in a single NUMA node across both sockets, so it's still pretty valid in terms of how things work.I'm not fixing it to a given L3 in the system (except for that socket), binding a thread doesn't tell the hardware to somehow stick that cacheline there forever, software has zero say in that. As you see in the results it's able to move around between the different L3's and CCXs. Intel moves (or mirrors it) it around between sockets and NUMA domains, so your premise there also isn't correct in that case, AMD currently can't because probably they don't have a way to decide most recent ownership between two remote CCXs.
People may want to just look at the local socket numbers if they prioritise that, the test method here merely just exposes further more complicated scenarios which I find interesting as they showcase fundamental cache coherency differences between the platforms.
mkbosmans - Tuesday, March 23, 2021 - link
For a quick overview of how cores are related to each other (with an allocation local to one of the cores), I like this way of visualizing it more:http://bosmans.ch/share/naples-core-latency.png
Here you can for example clearly see how the four dies of the two sockets are connected pairwise.
The plots from the article are interesting in that they show the vast difference between the cc protocols of AMD and Intel. And the numbers from the Naples plot I've linked can be mostly gotten from the more elaborate plots from the article, although it is not entirely clear to me how to exactly extend the data to form my style of plots. That's why I prefer to measure the data I'm interested in directly and plot that.
imaskar - Monday, March 29, 2021 - link
Looking at the shares sinking, this pricing was a miss...mode_13h - Tuesday, March 30, 2021 - link
Prices are a lot easier to lower than to raise. And as long as they can sell all their production allocation, the price won't have been too high.Zone98 - Friday, April 23, 2021 - link
Great work! However I'm not getting why in the c2c matrix cores 62 and 74 wouldn't have a ~90ns latency as in the NW socket. Could you clarify how the test works?node55 - Tuesday, April 27, 2021 - link
Why are the cpus not consistent?Why do you switch between 7713 and 7763 on Milan and 7662 and 7742 on Rome?
Why do you not have results for all the server CPUs? This confuses the comparison of e.g. 7662 vs 7713. (My current buying decision )