NVIDIA’s GeForce GTX Titan Review, Part 2: Titan's Performance Unveiled
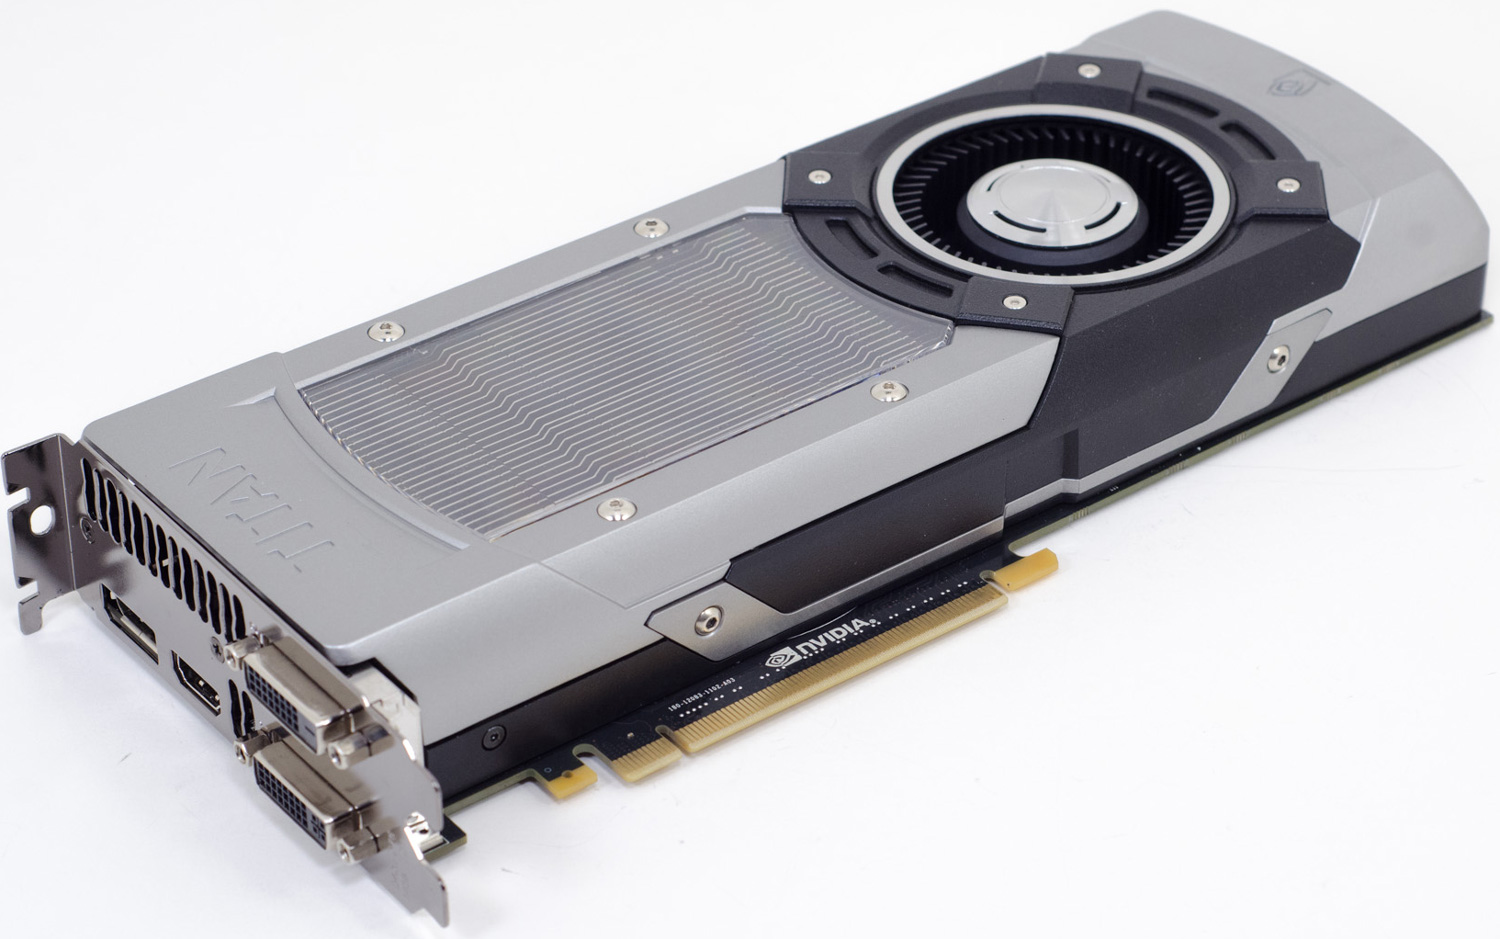
by Ryan Smith & Rahul Garg on February 21, 2013 9:00 AM ESTEarlier this week NVIDIA announced their new top-end single-GPU consumer card, the GeForce GTX Titan. Built on NVIDIA’s GK110 and named after the same supercomputer that GK110 first powered, the GTX Titan is in many ways the apex of the Kepler family of GPUs first introduced nearly one year ago. With anywhere between 25% and 50% more resources than NVIDIA’s GeForce GTX 680, Titan is intended to be the ultimate single-GPU card for this generation.
Meanwhile with the launch of Titan NVIDIA has repositioned their traditional video card lineup to change who the ultimate video card will be chasing. With a price of $999 Titan is decidedly out of the price/performance race; Titan will be a luxury product, geared towards a mix of low-end compute customers and ultra-enthusiasts who can justify buying a luxury product to get their hands on a GK110 video card. So in many ways this is a different kind of launch than any other high performance consumer card that has come before it.
So where does that leave us? On Tuesday we could talk about Titan’s specifications, construction, architecture, and features. But the all-important performance data would be withheld another two days until today. So with Thursday finally upon us, let’s finish our look at Titan with our collected performance data and our analysis.
Titan: A Performance Summary
| GTX Titan | GTX 690 | GTX 680 | GTX 580 | |
| Stream Processors | 2688 | 2 x 1536 | 1536 | 512 |
| Texture Units | 224 | 2 x 128 | 128 | 64 |
| ROPs | 48 | 2 x 32 | 32 | 48 |
| Core Clock | 837MHz | 915MHz | 1006MHz | 772MHz |
| Shader Clock | N/A | N/A | N/A | 1544MHz |
| Boost Clock | 876Mhz | 1019MHz | 1058MHz | N/A |
| Memory Clock | 6.008GHz GDDR5 | 6.008GHz GDDR5 | 6.008GHz GDDR5 | 4.008GHz GDDR5 |
| Memory Bus Width | 384-bit | 2 x 256-bit | 256-bit | 384-bit |
| VRAM | 6GB | 2 x 2GB | 2GB | 1.5GB |
| FP64 | 1/3 FP32 | 1/24 FP32 | 1/24 FP32 | 1/8 FP32 |
| TDP | 250W | 300W | 195W | 244W |
| Transistor Count | 7.1B | 2 x 3.5B | 3.5B | 3B |
| Manufacturing Process | TSMC 28nm | TSMC 28nm | TSMC 28nm | TSMC 40nm |
| Launch Price | $999 | $999 | $499 | $499 |
On paper, compared to GTX 680, Titan offers anywhere between a 25% and 50% increase in resource. At the starting end, Titan comes with 25% more ROP throughput, a combination of Titan’s 50% increase in ROP count and simultaneous decrease in clockspeeds relative to GTX 680. Shading and texturing performance meanwhile benefits even more from the expansion of the number of SMXes, from 8 to 14. And finally, Titan has a full 50% more memory bandwidth than GTX 680.
Setting aside the unique scenario of compute for a moment, this means that Titan will be between 25% and 50% faster than GTX 680 in GPU limited situations, depending on the game/application and its mix of resource usage. For an industry and userbase still trying to come to terms with the loss of nearly annual half-node jumps, this kind of performance jump on the same node is quite remarkable. At the same time it also sets expectations for how future products may unfold; one way to compensate for the loss of the rapid cadence in manufacturing nodes is to spread out the gains from a new node over multiple years, and this is essentially what we’ve seen with the Kepler family by launching GK104, and a year later GK110.
In any case, while Titan can improve gaming performance by up to 50%, NVIDIA has decided to release Titan as a luxury product with a price roughly 120% higher than the GTX 680. This means that Titan will not be positioned to push the price of NVIDIA’s current cards down, and in fact it’s priced right off the currently hyper-competitive price-performance curve that the GTX 680/670 and Radeon HD 7970GE/7970 currently occupy.
| February 2013 GPU Pricing Comparison | |||||
| AMD | Price | NVIDIA | |||
| $1000 | GeForce Titan/GTX 690 | ||||
| (Unofficial) Radeon HD 7990 | $900 | ||||
| Radeon HD 7970 GHz Edition | $450 | GeForce GTX 680 | |||
| Radeon HD 7970 | $390 | ||||
| $350 | GeForce GTX 670 | ||||
| Radeon HD 7950 | $300 | ||||
This setup isn’t unprecedented – the GTX 690 more or less created this precedent last May – but it means Titan is a very straightforward case of paying 120% more for 50% more performance; the last 10% always costs more. What this means is that the vast majority of gamers will simply be shut out from Titan at this price, but for those who can afford Titan’s $999 price tag NVIDIA believes they have put together a powerful card and a convincing case to pay for luxury.
So what can potential Titan buyers look forward to on the performance front? As always we’ll do a complete breakdown of performance in the following pages, but we wanted to open up this article with a quick summary of performance. So with that said, let’s take a look at some numbers.
| GeForce GTX Titan Performance Summary (2560x1440) | ||||||
| vs. GTX 680 | vs. GTX 690 | vs. R7970GE | vs. R7990 | |||
| Average | +47% | -15% | 34% | -19% | ||
| Dirt: Showdown | 47% | -5% | 3% | -38% | ||
| Total War: Shogun 2 | 50% | -15% | 62% | 1% | ||
| Hitman: Absolution | 34% | -15% | 18% | -15% | ||
| Sleeping Dogs | 49% | -15% | 17% | -30% | ||
| Crysis | 54% | -13% | 21% | -25% | ||
| Far Cry 3 | 35% | -23% | 37% | -15% | ||
| Battlefield 3 | 48% | -18% | 52% | -11% | ||
| Civilization V | 59% | -9% | 60% | 0 | ||
Looking first at NVIDIA’s product line, Titan is anywhere between 33% and 54% faster than the GTX 680. In fact with the exception of Hitman: Absolution, a somewhat CPU-bound benchmark, Titan’s performance relative to the GTX 680 is actually very consistent at a narrow 45%-55% range. Titan and GTX 680 are of course based on the same fundamental Kepler architecture, so there haven’t been any fundamental architecture changes between the two; Titan is exactly what you’d expect out of a bigger Kepler GPU. At the same time this is made all the more interesting due to the fact that Titan’s real-world performance advantage of 45%-55% is so close to its peak theoretical performance advantage of 50%, indicating that Titan doesn’t lose much (if anything) in efficiency when scaled up, and that the games we’re testing today favor memory bandwidth and shader/texturing performance over ROP throughput.
Moving on, while Titan offers a very consistent performance advantage over the architecturally similar GTX 680, it’s quite a different story when compared to AMD’s fastest single-GPU product, the Radeon HD 7970 GHz Edition. As we’ve seen time and time again this generation, the difference in performance between AMD and NVIDIA GPUs not only varies with the test and settings, but dramatically so. As a result Titan is anywhere between being merely equal to the 7970GE to being nearly a generation ahead of it.
At the low-end of the scale we have DiRT: Showdown, where Titan’s lead is less than 3%. At the other end is Total War: Shogun 2, where Titan is a good 62% faster than the 7970GE. The average gain over the 7970GE is almost right in the middle at 34%, reflecting a mix of games where the two are close, the two are far, and the two are anywhere in between. With recent driver advancements having helped the 7970GE pull ahead of the GTX 680, NVIDIA had to work harder to take back their lead and to do so in an concrete manner.
Titan’s final competition are the dual-GPU cards of this generation, the GK104 based GTX 690, and the officially unofficial Tahiti based HD 7990 cards, which vary in specs but generally have just shy of the performance of a pair of 7970s. As we’ve seen in past generations, when it comes to raw performance one big GPU is no match for two smaller GPUs, and the same is true with Titan. For frames per second and nothing else, Titan cannot compete with those cards. But as we’ll see there are still some very good reasons for Titan’s existence, and areas Titan excels at that even two lesser GPUs cannot match.
None of this of course accounts for compute. Simply put, Titan stands alone in the compute world. As the first consumer GK110 GPU based video card there’s nothing quite like it. We’ll see why that is in our look at compute performance, but as far as the competitive landscape is concerned there’s not a lot to discuss here.


337 Comments
View All Comments
CeriseCogburn - Saturday, February 23, 2013 - link
Here you are arac, some places can do things this place claims it cannot.See the massive spanking amd suffers.
http://www.bit-tech.net/hardware/2013/02/21/nvidia...
That's beyond a 40% lead for the nvidia Titan above and beyond the amd flagship. LOL
No problem. No cpu limited crap. I guess some places know how to test.
TITAN 110 min 156 max
7970ghz 72 min 94 max
TheJian - Sunday, February 24, 2013 - link
Jeez, I wish I had read your post before digging up my links. Yours is worse than mine making my point on skyrim even more valid.In your link the GTX670 takes out the 7970ghz even at 2560x1200. I thought all these dumb NV cards were bandwidth limited ;) Clear separation on all cards in this "cpu limited" benchmark on ALL resolutions.
Hold on let me wrap my head around this...So with your site, and my 3 links to skyrim benchmarks in my posts (one of them right here at anandtech telling how to add gfx, their 7970ghz article), 3/4 of them showing separations according to their GPU class...Doesn't that mean they are NOT cpu bound? Am I missing something here? :) Are you wondering if Ryan benched skyrim with the hi-res pack after it came out, found it got smacked around by NV and dropped it? I mean he's claiming he tested it right above your post and found skyrim cpu limited. Is he claiming he didn't think adding a HI-RES PACK that's official would NOT add graphical slowdowns? This isn't a LOW-RES pack right?
http://www.anandtech.com/show/6025/radeon-hd-7970-...
Isn't that Ryan's article:
"We may have to look at running extra graphics effects (e.g. TrSSAA/AAA) to thin the herd in the future."...Yep I think that's his point. PUT IN THE FREAKIN PACK. Because Skyrim didn't just become worthless as a benchmark as TONS are playing it, unlike Crysis Warhead and Dirt Showdown. Which you can feel free to check the server link I gave, nobody playing Warhead today either. I don't think anyone ever played Showdown to begin with (unlike warhead which actually was fun in circa 2008).
http://www.vgchartz.com/game/23202/crysis-warhead/
Global sales .01mil...That's a decimal point right?
http://www.vgchartz.com/game/70754/dirt-showdown/
It hasn't reached enough sales to post the decimal point. Heck xbox360 only sold 140K units globally. Meanwhile:
http://www.vgchartz.com/game/49111/the-elder-scrol...
2.75million sold (that's not a decimal any more)! Which one should be in the new game suite? Mods and ratings are keeping this game relevant for a long time to come. That's the PC sales ONLY (which is all we're counting here anyway).
http://elderscrolls.wikia.com/wiki/Official_Add-on...
The high-res patch is an OFFICIAL addon. Can't see why it's wrong to benchmark what EVERYONE would download to check out that bought the game, released feb 2012. Heck benchmark dawnguard or something. It came Aug 2012. I'm pretty sure it's still selling and being played. PCper, techpowerup, anandtech's review of the 7970ghz and now this bit-tech.net site. Skyrim's not worth benching but all 4 links show what to do (up the gfx!) and results come through fine and 3 sites show NV winning (your site of course the one of the four that ignores the game - hmm, sort of shows my bias comment doesn't it?). No cpu limit at 3 other sites who installed the OFFICIAL pack I guess, but you can't be bothered to test a HI-RES pack that surely stresses a gpu harder than without? What are we supposed to believe here?
Looks like you may have a point Cerise.
Thanks for the link BTW:
http://www.bit-tech.net/hardware/2013/02/21/nvidia...
You can consider witcher 2 added as a 15th benchmarkable game you left out Ryan. Just wish they'd turn on ubersampling. As mins are ~55 for titan here even at 2560x1600. Clearly with it on this would be a NON cpu limited game too (it isn't cpu limited even off). Please refrain from benchmarking games with less than a 100K units in sales. By definition that means nobody is playing them OR buying them right? And further we can extrapolate that nobody cares about their performance. Can anyone explain why skyrim with hires (and an addon that came after) is excluded but TWO games with basically ZERO sales are in here as important games that will be hanging with us for a few years?
CeriseCogburn - Tuesday, February 26, 2013 - link
Yes, appreciate it thanks, and your links I'll be checking out now.They already floated the poster vote article for the new game bench lineup, and what was settled upon already was Never Settle heavily flavored, so don't expect anything but the same or worse here.
That's how it goes and there's a lot of pressure and PC populism and that great 2 week yearly vacation, and certainly attempting to prop a dying amd ship that "enables" this whole branch of competition for review sites is certainly not ignored. A hand up, a hand out, give em hand !
lol
Did you see where Wiz there at TPU in Titan review mentioned nVidia SLI plays 18 of 19 in house game tests and amd CF fails on 6 of them... currently fails on 6 of 19.
" NVIDIA has done a very good job here in the past, and out of the 19 games in our test suite, SLI only fails in F1 2012. Compare that to 6 out of 19 failed titles with AMD CrossFire. "
http://www.techpowerup.com/reviews/NVIDIA/GeForce_...
So the amd fanboys have a real problem recommending 79xx rather 7xxx or 6xxx doubled or tripled up as an alternative with equal or better cost and "some performance wins" when THIRTY THREE PERCENT OF THE TIME AMD CF FAILS.
I'm sorry, I was supposed to lie about that and claim all of amd's driver issues are behind it and it's all equal and amd used to have problems and blah blah blah the green troll company has driver issues too and blah blah blah...
CeriseCogburn - Tuesday, February 26, 2013 - link
Oh man, investigative reporting....lol" http://www.vgchartz.com/game/23202/crysis-warhead/
Global sales .01mil...That's a decimal point right?
http://www.vgchartz.com/game/70754/dirt-showdown/
It hasn't reached enough sales to post the decimal point. Heck xbox360 only sold 140K units globally. Meanwhile:
http://www.vgchartz.com/game/49111/the-elder-scrol...
2.75million sold (that's not a decimal any more)! Which one should be in the new game suite? "
Well it's just a mad, mad, amd world ain't it.
You have a MASSIVE point there.
Excellent link, that's a bookmark.
Zingam - Thursday, February 21, 2013 - link
GeForce Titan "That means 1/3 FP32 performance, or roughly 1.3TFLOPS"Playstation 4 "High-end PC GPU (also built by AMD), delivering 1.84TFLOPS of performance"
Can somebody explain to me how that above could be? GeForce Titan $999 graphics card has much lesser performance than what would be in basically (if I understand properly) an APU by AMD for $500 for the full system??? I doubt that Sony will accept $1000 or more loss but what I find even more doubtful that an APU could have that much performance.
Please, somebody clarify!
chizow - Thursday, February 21, 2013 - link
1/3 FP32 is double-precision FP64 throughput for Titanic. The PS4 must be quoting single-precision FP32 throughput and 1.84TFlops is nothing impressive in that regard. I believe GT200/RV670 were producing numbers in that range for single-precision FLOPs.Blazorthon - Thursday, February 21, 2013 - link
You are correct about PS4 quoting single precision and such, but I'm sure that you're wrong about GT200 being anywhere near 1.8TFLOPS in single precision. That number is right around the Radeon 7850.chizow - Saturday, February 23, 2013 - link
GT200 was around 1TFlop, I was confused because the same gen cards (RV670) were in the 1.2-1.3TFLOP range due to AMD's somewhat overstated VLIW5 theoretical peak numbers. Cypress for example was ~2.5TFlops so I wasn't too far off the mark in quoted TFLOPs.But yes if PS4 is GCN the performance would be closer to a 7850 in an apples to apples comparison.
frogger4 - Thursday, February 21, 2013 - link
Yep, the quoted number for the PS4 is the single precision performance. It's just over the single precision FP for the HD7850 at 1.76flops, and it has one more compute unit, so that makes sense. The double precision for Pitcairn GPUs is 1/16th of that.The single precision performance for the Titan is (more than) three times the 1.3Tflop double precision number. Hope that clears it up!
StealthGhost - Thursday, February 21, 2013 - link
Why are the settings/resolution used for, at least Battlefield 3, not consistent with those used in previous tests on GPUs, most directly those in Bench? Makes it harder to compare.Bench is such a great tool, it should be constantly updated and completely relevant, not discarded like it seems to be with these tests.